The Social Vulnerability Index (SVI) : A way to identify socially vulnerable populations
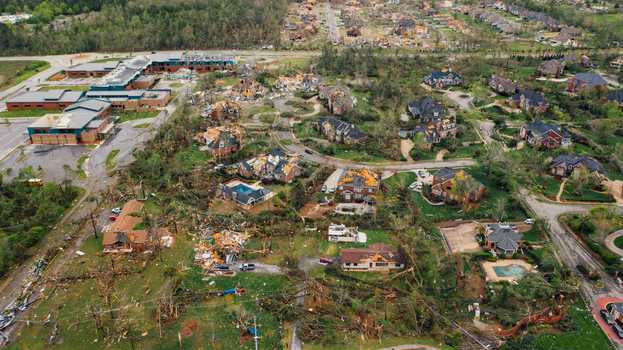
Social vulnerability refers to the capacity of people or groups to anticipate, respond and recover from the impact of external stresses to which they are exposed, such as natural or human-caused disasters, or disease outbreaks. By effectively addressing and reducing social vulnerability, we can decrease both human suffering and economic losses.

Aug 8, 2020 - 5 minutes read
About the Social Vulnerability Index
CDC’s Social Vulnerability Index (SVI) is a tool to spatially identify socially vulnerable populations. The SVI uses U.S. Census variables that reflect at-risk populations to identify and map vulnerable areas. Information on the location and relative concentration of different types of social vulnerabilities in small geographic areas, such as census tracts can help emergency managers locate and plan for the specific needs of their communities, before, during, and after a disaster.
In order to calculate the 2018 SVI, the Centers for Disease Control and Prevention (CDC) employed data from the 2014–2018 American Community Survey (ACS) 5-Year Estimates. SVI indicates the relative vulnerability of every U.S. Census tract which are subdivisions of counties for which the Census collects statistical data.
The SVI draws together 15 different measures of vulnerability in 4 different themes :
- Socioeconomic Status
- Household Composition & Disability
- Minority Status & Language
- Housing Type & Transportation
Using a percentile ranking method, each tract receives a separate ranking from 0 (lowest vulnerability) to 1 (highest vulnerability) for each of the 4 themes, as well as an overall ranking.
For each tract, CDC generated its percentile rank among all tracts for the fifteen individual variables, the four themes, and its overall position. For each of the four themes, CDC summed the percentiles for the variables comprising each theme. Finally, CDC ordered the summed percentiles for each theme to determine theme-specific percentile rankings.
Mapping Results
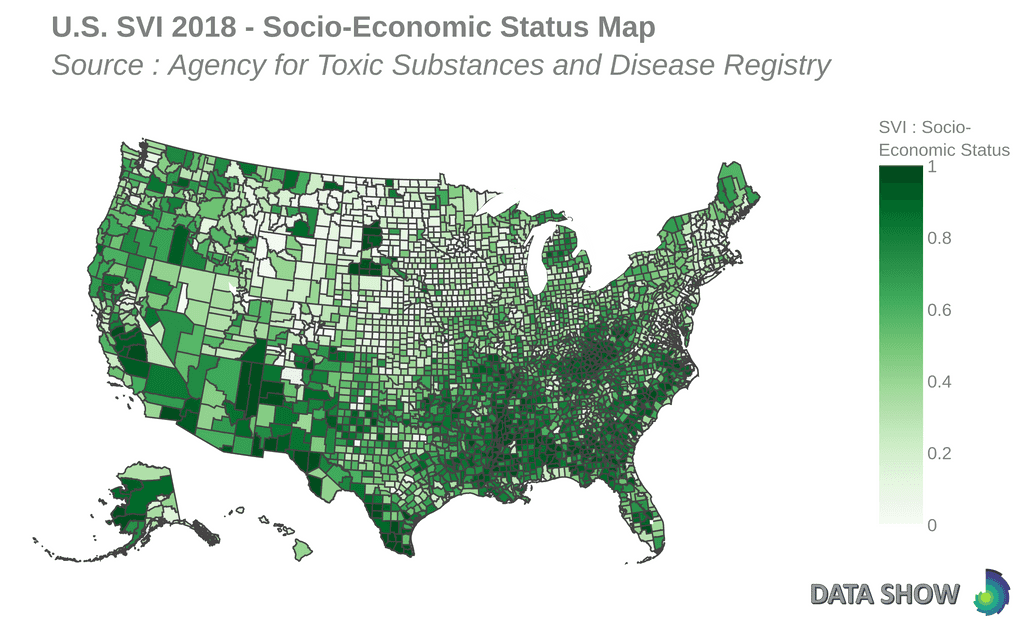
Socioeconomic Status
Economically disadvantaged populations are disproportionately affected by disasters. The poor are less likely to have the income or assets needed to prepare for a possible disaster or to recover after a disaster.
Socioeconomic Status theme is composed with the following variables :
- Persons below poverty
- Civilian (age 16+) unemployed
- Per capita income
- Persons (age 25+) with no high school diploma
Household Composition & Disability
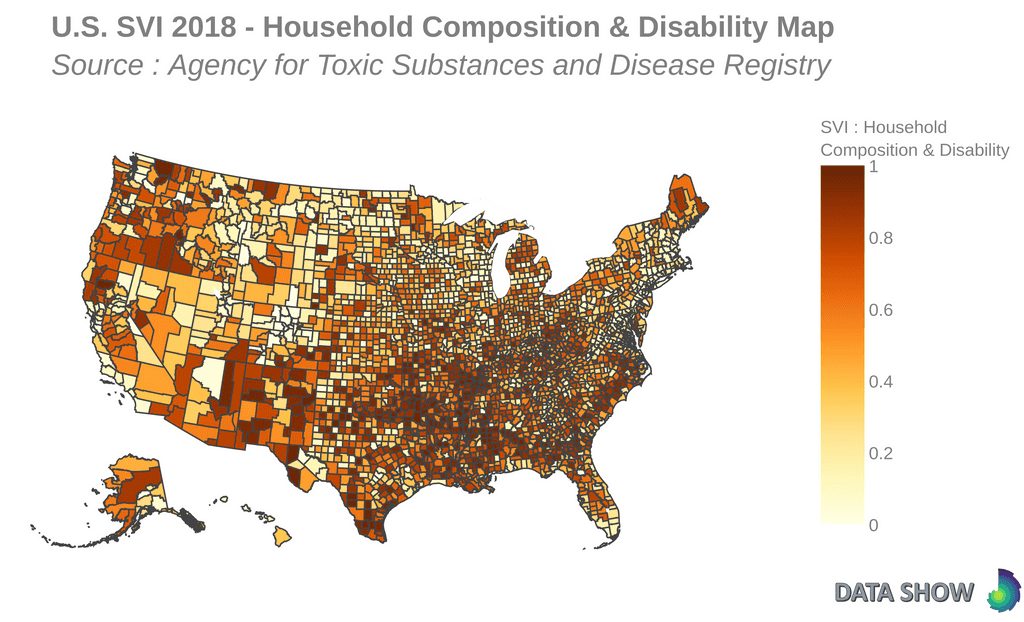
Household composition is defined here to include dependent children less than 18 years of age, persons aged 65 years and older, and single-parent households. Also included are people with disabilities. People in any of these categories are the most vulnerable groups in disaster events and are likelier to require financial support, transportation, medical care, or assistance with ordinary daily activities during disasters.
Household Composition & Disability theme is composed with the following variables :
- Persons aged 65 and older
- Persons aged 17 and younger
- Civilian non institutionalized population with a disability
- Single parent household with children under 18
Minority Status & Language
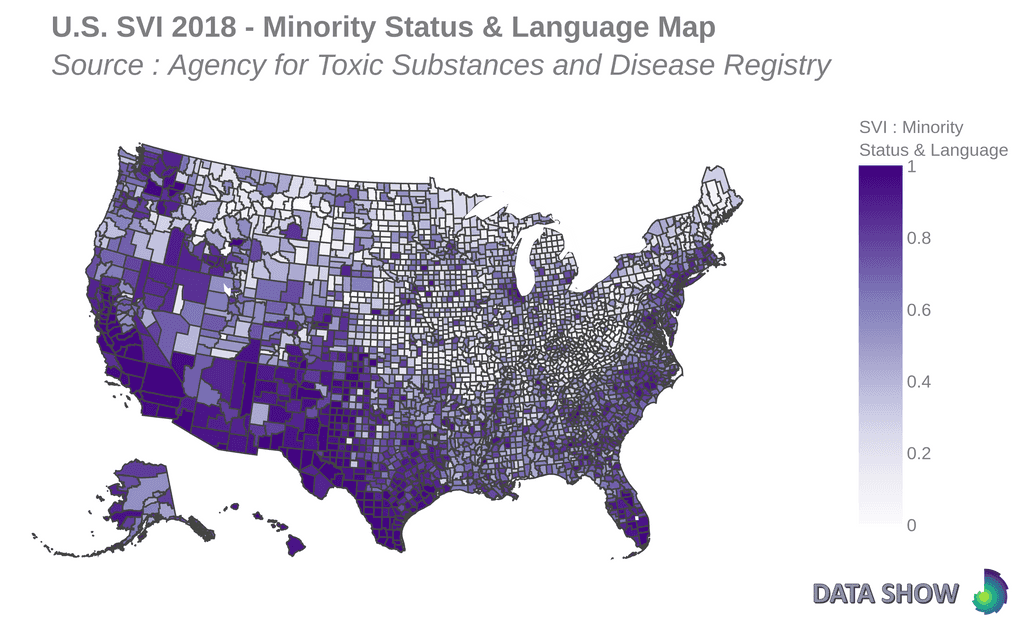
The social and economic marginalization of certain racial and ethnic groups, including real estate discrimination, has rendered these populations more vulnerable at all stages of disaster. African Americans, Native Americans, and populations of Asian, Pacific Islander, or Hispanic origin are correlated with higher vulnerability rates.
Minority Status & Language theme is composed with the following variables :
- Minority (all persons except white, non Hispanic)
- Persons (age 5+) who speak English “less than well”
Housing Type & Transportation
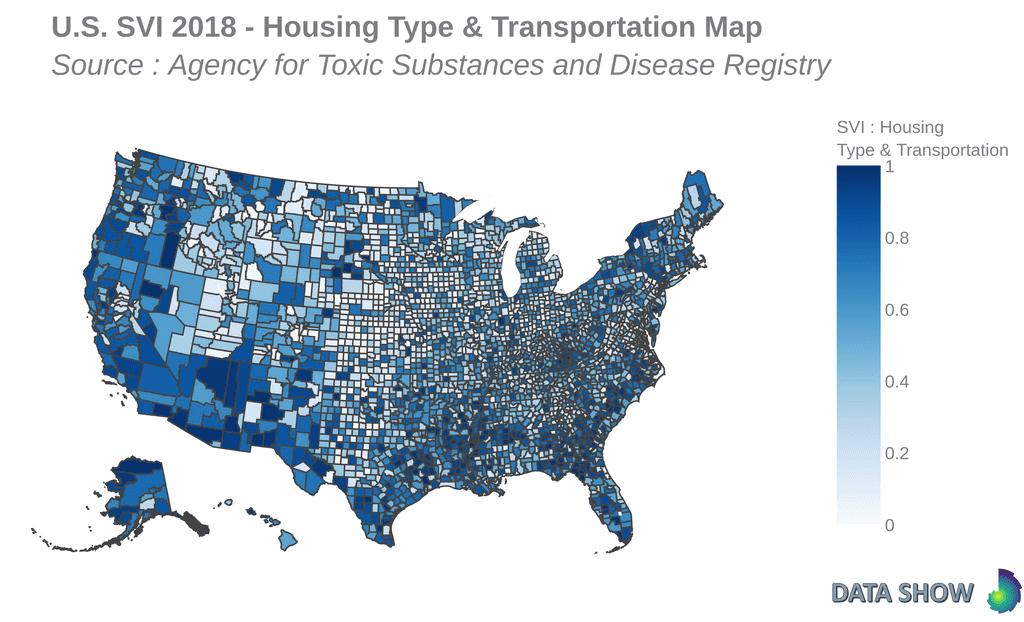
Housing quality is an important factor in evaluating disaster vulnerability. It is closely tied to personal wealth, that is, poor people often live in more poorly constructed houses or mobile homes that are especially vulnerable to strong storms or earthquakes.
Housing Type & Transportation theme is composed with the following variables :
- Housing in structures with 10 or more units
- Mobile homes
- At household level (occupied housing units), more people than rooms
- Households with no vehicle available
- Persons in institutionalized group quarters
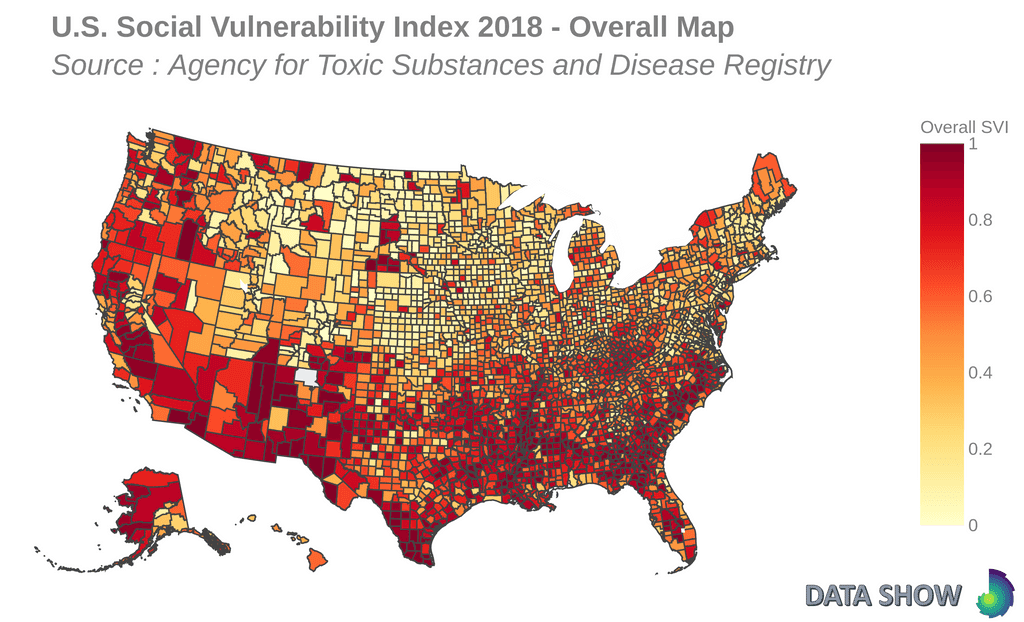
Overall SVI
The sum of the 4 themes scores gives us an overall social vulnerability score and brings to light an overall SVI trend.
SVI limitations
Social vulnerability is complex, and cross sectional indexes such as the SVI are merely estimates.
While census data remains the best available, the SVI is only an estimate of aggregate vulnerability, and as such is not appropriate for individual-level analysis. Indeed, data are collected from a sample of the population in the United States rather than from the whole population.
There are likely additional place-based factors contributing to community level social vulnerability, not included in SVI estimates, which and should always be considered if it is available, as they might be more accurate at the local level.
Index results still remain estimates and should be treated as such, as just a first step in screening for populations that may be more or less vulnerable.
Did you find this article interesting ? Subscribe to the newsletter.


