Olympic and Asian games - the path to the medal count
Some countries dominate the number of medals in the Asian Games, but win far fewer medals in the Olympics. Others do not win any medals in these two competitions. How to use research methodology to set up a data analysis?

Dec 17, 2020 - 7 minutes read
Tools of the trade
High-quality ingredients are necessary for a good dish – this is something every good chef knows. However, ingredients need to be prepared before they are cooked. A good chef will never use the same knife for chopping onions and cutting meat. Simultaneously with using specific tools in specific situations, some rules need to be respected in order to make an edible meal. When making omelets, eggs need to be poured into a heated pan, but the meal will not be edible if the eggshells are not removed prior to cooking.
Analogously to cooking, each science uses specific methods to answer specific questions. Although research methods in the social and natural sciences differ, each scientist or analyst uses the most appropriate method to explore particular topic.
What to analyse?
The basis of every research or analysis is a clear definition of the problem which is being explored. Additionally, a unit of analysis, the thing that the gathered data refer to, should be determined. If the focus is on people’s attitudes towards usage of running water for personal hygiene, the unit of analysis are people. If the focus is on how the air pollution changes the purity of motor oil in a car, the unit of analysis is motor oil. The phenomena that are being observed need to be clearly defined as well. This can be the cleanness of the motor oil, or the strength of an attitude towards usage of running water.
Just like a good chef combines ingredients such as onions, carrots and broccoli into a dish, researchers use data as the main ingredients for their analysis. Data can be numerical, textual or even in the form of pictures. Conclusions about particular problems are made after a detailed look into the data. If the data are numerical, scientists or analysts will use various mathematical functions or statistical tests in order to get the most out of their data. If the data are in the form of text or pictures, other approaches will be used.
Analysis makes sense if its foundations are good. Data available on-line may be intriguing to analyse, but without a clearly defined goal, their true meaning can be hard to find.
The shape of content
Apart from the year of the COVID-19 outbreak, the Olympic games have been held successfully for many decades. Similarly, the Asian games, a sports event held in Asia every four years gathers different Asian countries to compete in various sports. Just like the Olympics, the Asian games have a summer and winter edition, and sports in these two huge international competitions mostly overlap.
Knowing that Asian countries compete with other Asian countries in the Asian games, and other world countries at the Olympic games, the following problem arises: How many medals have Asian countries won in the Olympic, and how many in the Asian games?
Steps towards the anwser
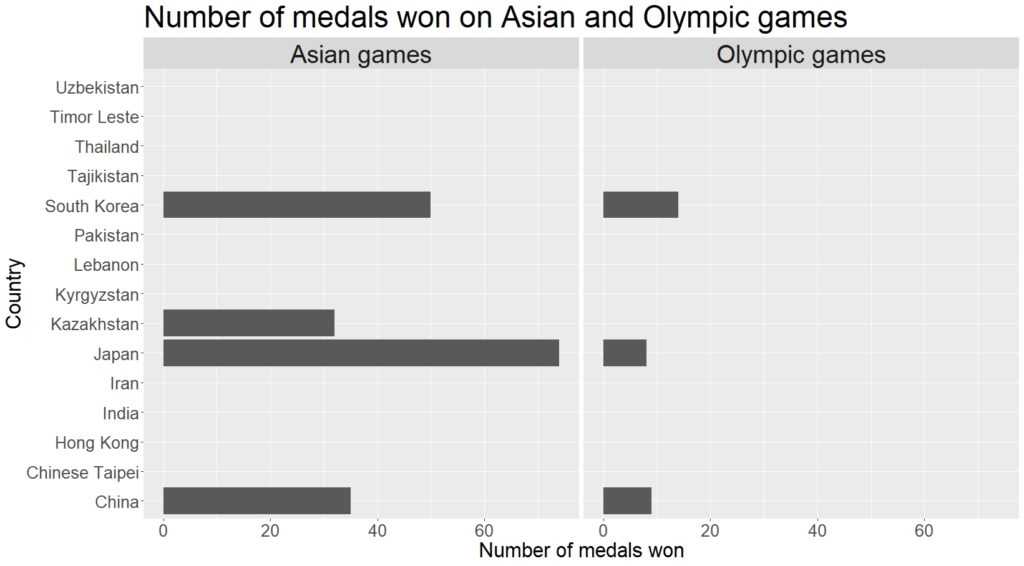
Taking a look at the medal count, and concluding that a particular country won more medals in one competition than the other, would be a simple but false approach. A more complex, but methodologically sound approach would consist of the following steps: 1. determine the indicator of success – in this case the number of medals won; 2. define the unit of analysis, Asian countries that competed in both the Asian and Olympic games; 3. determine which situations are being compared – 2014 winter Olympic games and 2017 winter Asian games; 4. decide which sports and sport disciplines appear in both of these sport events. Once these fundamental conditions are set up, the chart below can be made.

The graph indicates that countries which dominate in the Asian games, win fewer medals in the Olympic games.
Perfect analysis
No matter how hard an analyst or a researcher has tried to set up the analysis, the ideal conditions can never be met. In this example, the data for the 2014 winter Olympic games and the 2017 winter Asian games have been compared. However, the ideal scenario would be if the same athletes competed in both the Asian and Olympic games, in the same sport and sport disciplines, and that the time gap between Olympic and Asian games is as small as possible. That way, results from both of these competitions could be compared because there would be athletes from each of the Asian countries competing in the Olympic and Asian games in sports that appear in both of these competitions.
Since it is impossible to meet the ideal circumstances for this analysis, there are several reasons why the observed results should be taken critically into consideration. One is that athletes who have competed in 2014 may not have competed three years later in the Asian games. In the data gathered on-line, it is not always possible to have insight into all the people who competed in all events. This means that there are different people in two different situations, in two different time periods, which has an effect on the competition results, and the validity of the findings.
Furthermore, the importance of these competitions at state level or particular sport level is unknown. In some sports, an Olympic medal is less important than a medal is some other competition. For example, the football tournament in the Olympic games is less attractive than the football World cup. Since the Olympic football tournament in the Olympic games is not part of the FIFA competition, clubs are not obliged to send their players to compete it the Olympic games. Additionally, the age limit of 23 years does not allow all football players to appear in the Olympic football tournament. Hence, one country might invest more in a sport that is considered to have more chances of winning a medal in one competition, but not the other.
The bigger picture
Although this visualization depicts the success of Asian countries in two competitions, it can be used to draw indirect conclusions about the strength of traditionally successful countries that compete in the Olympic winter games such as Canada, USA or Norway. Since these countries do not compete in the Asian games, the number of medals won by Japan, China, South Korea and Kazakhstan increases.
It is worth noting that the results of this analysis are not completely wrong and should not be discarded. Sometimes a researcher or an analyst has to deal with the data they have. Therefore, making conclusions from data is a difficult process. Extracting information from data requires knowledge of the subject matter, methodology, type of analysis that will be conducted and the context in which the data are gathered and interpreted. If the analysis has good foundations, the conclusions can be considered valid, worthy of further exploration and can be used for different purposes.
Suggestions for reading
Goodwin, C. J., & Goodwin, K. A. (2016). Research in psychology methods and design. John Wiley & Sons.
Pashler, H. (2004). Stevens’ Handbook of Experimental Psychology, Methodology in Experimental Psychology. John Wiley & Sons.
Shaughnessy, J. J., Zechmeister, E. B., & Zechmeister, J. S. (2000). Research methods in psychology. McGraw-Hill.
Sources
There is no sources for this article.
Notebooks
There is no notebooks for this article.
Did you find this article interesting ? Subscribe to the newsletter.


