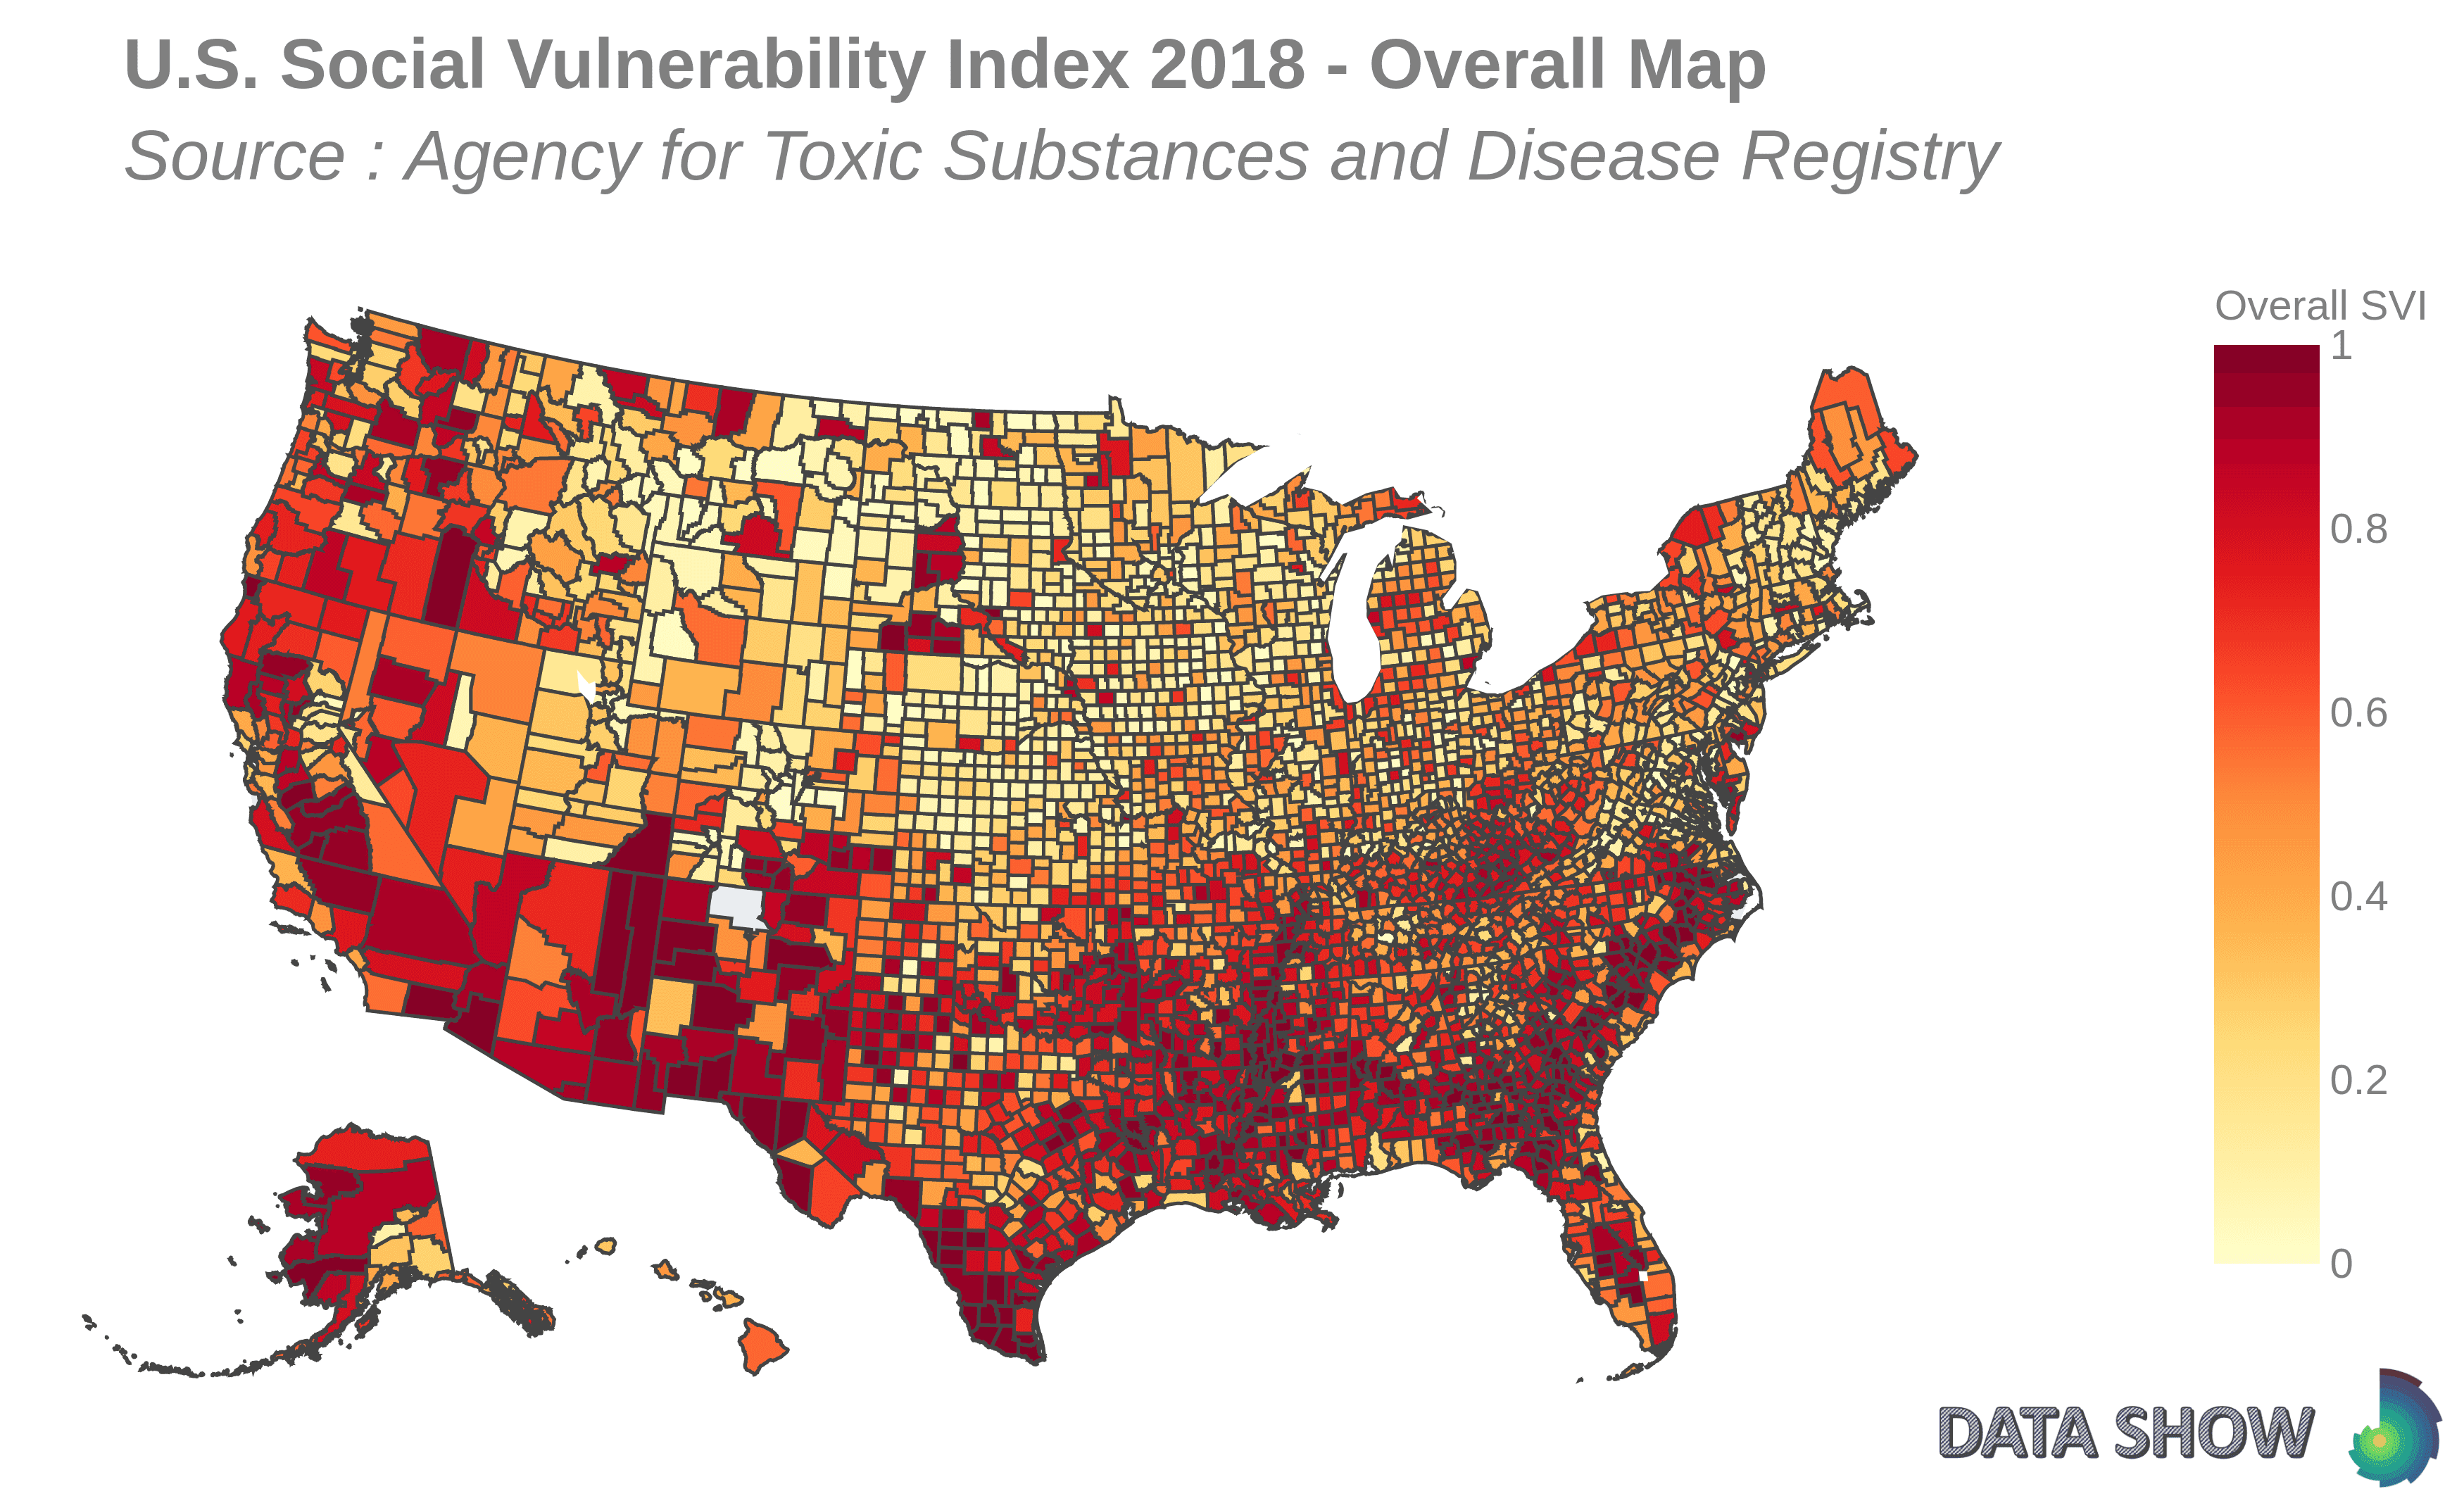
U.S. Social Vulnerability Index 2018 - Overall Map
Social vulnerability references to the capacity of populations to be prepared for, react to and get back from the impact of external stresses to which they are exposed. The SVI uses U.S. Census data that focus on at-risk populations to identify and map vulnerable areas. Using a percentile ranking method, each tract receives a separate score from 0, corresponding to the lowest vulnerability, to 1 corresponding to the highest vulnerability. Addressing and effectively reducing social vulnerability could help limit both human suffering and economic loss in the face of disaster events.

Morgane Bougouin
Aug 29, 2020

